عضویت
عضویت  ورود اعضا
 راهنمای خرید


Sulfur In Crude Online Analyzer0 pages
SENSSVOLUTION
Industrial measurement & analysis solutions
e
BASE BA-SLFIC
Online Sulfur In Crude Analyzer
(UV spectroscopy method)
The BASE
BA-SLFIC
is part of
the BAGGI
BASE®
Instrument
Series.
They are
the result
of combining the latest state-of-the-art-
technology with over 50 years of industry
experience.
The BA-SLFIC is an online analyzer for
continuous, reliable and accurate measurement
of the concentration of sulfur in crude oil. It is
available for operation in an explosive
atmosphere (ATEX) environment. The sample
flow is fed to a thermal oxidizer that generates a
flow of gas. An Ultraviolet spectroscopy
analyzer measures the sulphur dioxide (S02)
level in this flow with great precision. It is suited
for ultra-low sulphur concentration monitoring.
Accurate measurement of sulfur is critical during
the refining and processing of fuels and oils. For
environmental reasons, and for its effect on
quality, sulfur content in hydrocarbons is
rigorously controlled by both national and
international regulations. In addition, maximum
levels for sulfur content in fuels continue to be
made even stricter, thus analytical
instrumentation today plays an even more
important role than ever before.
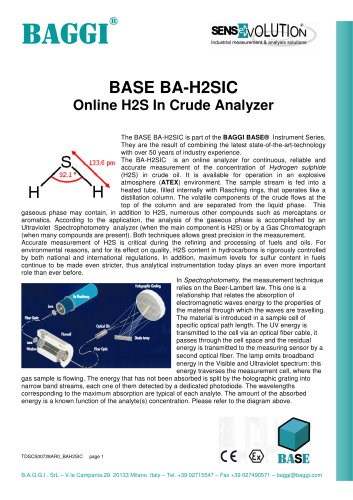
The offered instrument is based upon oxidation
of the Sulfur to S02 at 1000 QC, followed by
Ultraviolet Fluorescence S02 measurement.
This method is suitable for fluids up to a Final
Boiling Point (FBP) of 450 QC. Reference is
made to ASTM D5453 method for Total Sulfur in
petroleum products.
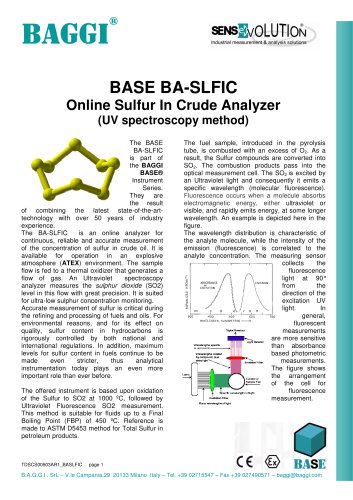
The fuel sample, introduced in the pyrolysis
tube, is combusted with an excess of 02. As a
result, the Sulfur compounds are converted into
S02. The combustion products pass into the
optical measurement cell. The S02 is excited by
an Ultraviolet light and consequently it emits a
specific wavelength (molecular fluorescence).
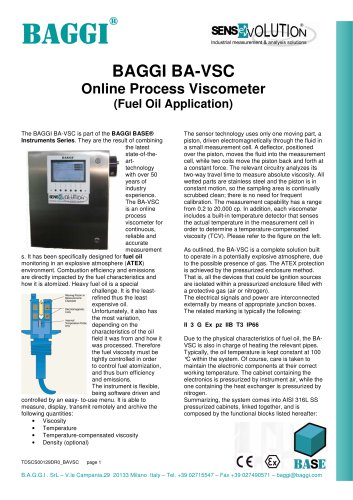
Fluorescence occurs when a molecule absorbs
electromagnetic energy, either ultraviolet or
visible, and rapidly emits energy, at some longer
wavelength. An example is depicted here in the
figure.
The wavelength distribution is characteristic of
the analyte molecule, while the intensity of the
emission (fluorescence) is correlated to the
analyte concentration. The measuring sensor
collects the
fluorescence
light at 90°
from the
direction of the
excitation UV
light. In
general,
fluorescent
measurements
are more sensitive
than absorbance
based photometric
measurements.
The figure shows
the arrangement
of the cell for
fluorescence
measurement.
400 SOO
WAVELMGTH. NANOMETERS ■
Emission Filter
Lamp
Sped fie wavelengths of light
Excitation Filter
Many wavelengths of light
C€ ® BASE
TDSCS00503AR1_BASLFIC page 1
B.A.G.G.I . SrL-V.le Campania,29 20133 Milano Italy - Tel.+39 02715547 - Fax+39 027490571 -baggi@baggi.com
"