عضویت
عضویت  ورود اعضا
 راهنمای خرید


ibaAnalyzer0 pages
Hardware
Software
Training
Applications
ibaAnalyzer
Description
ibaAnalyzer is one of the most powerful tools created by
iba. Once that data has been stored through any of our
online systems such as ibaPDA, ibaQDR or ibaLogic the
data-files (*.dat) can be analyzed online and offline using
ibaAnalyzer. It is very common that an acquisition server
such as ibaPDA is connected to a local network, which provides access to the data for multiple users interested in
further analysis. Such files are found available via a network access. It is possible to analyze the files at the moment they have been stored giving the opportunity to have
the latest information of the process available. It is also
possible to configure ibaPDA in a way that it automati
cally starts an ibaAnalyzer analysis process of the last file
stored.
ibaAnalyzer is free of charge when used with a licensed
online software package of iba, although is has been one
of the most budget-consuming developments at iba. How
ever, the concept has been successful because it is usually
linked to a purchase of a license of our online data acquisition tools, such as ibaPDA etc. The software for ana
lysis which is required at many workplaces is free. Hence,
ibaAnalyzer may be copied and installed as many times as
needed so that all engineers and qualified personnel can
analyze data files for mechanical, electrical or technological characteristics. Typically maintenance, automation
and process engineers will be interested in these files.
More ver it is possible to send a data file together with
o
ibaAnalyzer to a customer or a business partner.
The use of ibaPDA and ibaAnalyzer will make you stop
using old chart recorders, eliminating paper costs, empty
paperrolls and ink cartridges or besmeared and crumpled
printouts with all the difficulties and limitiations of that
kind of analysis.
Another important advantage of having information in files
is that these files can be sent through email to the service
engineers that know the processes of the plant very well
so that they can help to solve possible problems remotely.
(„Remote Maintenance“)
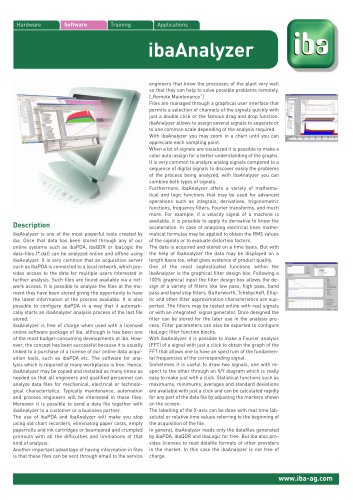
Files are managed through a graphical user interface that
permits a selection of channels of the signals quickly with
just a double click or the famous drag and drop function.
ibaAnalyzer allows to assign several signals to separate or
to one common scale depending of the analysis required.
With ibaAnalyzer you may zoom in a chart until you can
appreciate each sampling point.
When a lot of signals are visualized it is possible to make a
color auto-assign for a better understanding of the graphs.
It is very common to analyze analog signals compared to a
sequence of digital signals to discover easily the problems
of the process being analyzed, with ibaAnalyzer you can
combine both types of signals.
Furthermore, ibaAnalyzer offers a variety of mathematical and logic functions that may be used for advanced
operations such as integrals, derivatives, trigonometric
functions, frequency filters, Fourier transforms, and much
more. For example, if a velocity signal of a machine is
available, it is possible to apply its derivative to know the
acceleration. In case of analyzing electrical lines mathematical formulas may be applied to obtain the RMS values
of the signals or to evaluate distortion factors.
The data is acquired and stored on a time basis. But with
the help of ibaAnalyzer the data may be displayed on a
length basis too, what gives evidence of product quality.
One of the most sophisticated functions within the
ibaAnalyzer is the graphical filter design box. Following a
100% graphical input the filter design box allows the design of a variety of filters like low pass, high pass, band
pass and band stop filters. Butterworth, Tchebycheff, Elliptic and other filter approximation characteristics are supported. The filters may be tested online with real signals
or with an integrated signal generator. Once designed the
filter can be stored for the later use in the analysis process. Filter parameters can also be exported to configure
ibaLogic filter function blocks.
With ibaAnalyzer it is possible to make a Fourier analysis
(FFT) of a signal with just a click to obtain the graph of the
FFT that allows one to have an spectrum of the fundamental frequencies of the corresponding signal.
Sometimes it is useful to draw two signals, one with respect to the other through an X/Y diagram which is really
easy to make just with a click. Statistical functions such as
maximums, minimums, averages and standard deviations
are available with just a click and can be calculated rapidly
for any part of the data file by adjusting the markers shown
on the screen.
The labelling of the X-axis can be done with real time (absolute) or relative time values referring to the beginning of
the acquisition of the file.
In general, ibaAnalyzer reads only the datafiles generated
by ibaPDA, ibaQDR and ibaLogic for free. But iba also provides licenses to read datafile formats of other providers
in the market. In this case the ibaAnalyzer is not free of
charge.
www.iba-ag.com
"