عضویت
عضویت  ورود اعضا
 راهنمای خرید


Photodiode Energy Sensors0 pages
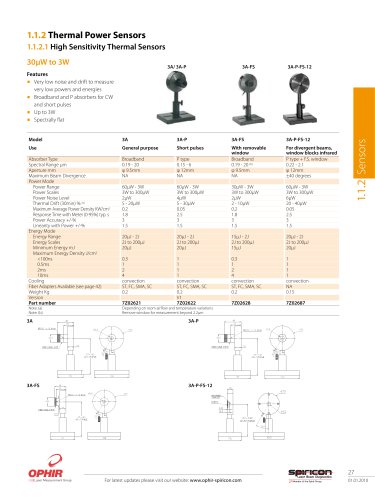
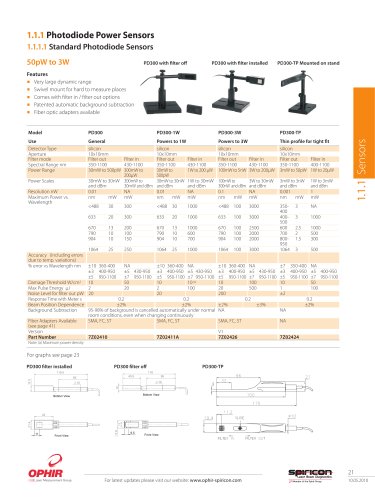
1.3.1 Photodiode Energy Sensors
10pJ to 15µJ
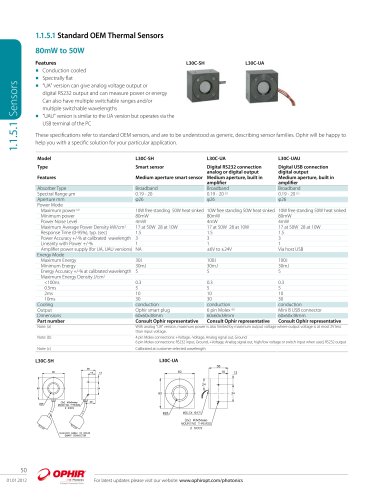
PD10 / PD10-pJ / PD10-IR-pJ
Model
PD10
PD10-pJ
PD10-IR-pJ
Use
Aperture mm
Absorber Type
Spectral Range µm (a)
Surface Reflectivity % approx.
Calibration Accuracy +/-% (a)
Energy Scales
Lowest Measurable Energy nJ
Max Pulse Width ms
Maximum Pulse Rate pps
Noise on Lowest Range nJ
Additional Error with Frequency %
Linearity with Energy for > 10% of full scale
Damage Threshold J/cm2
Maximum Average Power mW
Maximum Average Power Density W/cm2
Maximum Energy vs. Wavelength
Low energies
φ10
Si photodiode with attenuator
0.19 - 1.1
50
5
20µJ to 20nJ
2 at 900nm
0.005
10kHz
0.2
±1% to 10kHz
±1%
0.1
50 at 800nm
50
Wavelength
Maximum Energy
<300nm
15µJ
350-550nm
8µJ
>800nm
5µJ
Lowest energies
φ10
Si photodiode
0.2 - 1.1
30
5
200nJ to 200pJ
0.01 at 900nm
0.005
10kHz
0.002
±1% to 10kHz
±1%
0.1
0.5
5
Wavelength
Maximum Energy
<300nm
150nJ
350-550nm
75nJ
>800nm
50nJ
Fiber Adapters Available (see page 74)
Weight kg
Version
Part number: Standard Sensor
StarLink Sensor: Direct USB link to PC (p. 73)
ST, FC, SMA, SC
0.25
V2
7Z02823
787150
ST, FC, SMA, SC
0.25
V2
7Z02824
Infrared
φ5
Ge photodiode
0.7 - 1.8
30
5
20nJ to 200pJ
0.03 at 900nm
0.005
10kHz
0.010
±1.5% to 10kHz
±1%
0.1
0.5
5
Wavelength
800 - 900nm
1000 - 1300nm
1300 - 1400nm
1480 - 1560nm
>1650nm
ST, FC, SMA, SC
0.25
Note: (a) This is basic calibration accuracy. In certain
wavelength regions calibration there is additional error as
tabulated here.
<250nmt
>950nmt
<250nmt
>950nmt
1.3.1 Sensors
Features
ֺ
ֺ Silicon and Germanium detectors
ֺ
ֺ Very sensitive - down to 10pJ
ֺ
ֺ Repetition rates to 10kHz
ֺ
ֺ Wide spectral range
PD10 / PD10-pJ
add ±3%
add ±2%
add ±2%
add ±2%
Maximum Energy
20nJ
8nJ
7nJ
6nJ
20nJ
7Z02827
<900nmt
>1700nmt
add ±2%
add ±2%
PD10-IR-pJ
65
For latest updates please visit our website: www.ophiropt.com/photonics
01.01.2012