عضویت
عضویت  ورود اعضا
 راهنمای خرید


Why you need a true data visualization API0 pages

Why you need a true data visualization API
Technology Snapshot
As business graphics consume more screen real estate in desktop and
mobile apps, product managers and UX teams struggle to push “beyond
the bar chart” with innovative concepts that are difficult to productize and
frequently don’t scale to enterprise dimensions.
Advanced Visual Systems has developed a multifunction API that serves as
a rich canvas for the development of intelligent and interactive data
visualizations that have an intimate relationship with both the underlying
data and the end user.
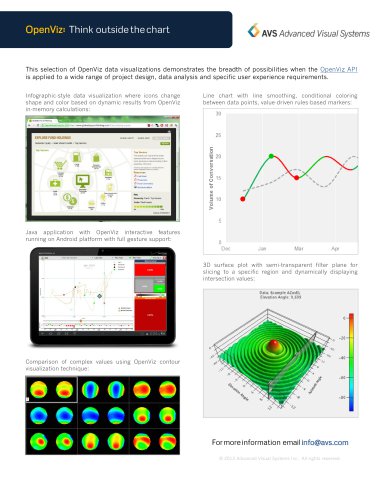
Think outside the chart
Data before visualization
For many ISV and OEM product
teams, some of the biggest barriers
to developing an innovative data
visualization strategy have been the
limits imposed by off-the-shelf
charting packages.
The OpenViz API consists of a flexible data management pipeline that
feeds many millions of in-memory
data points into a high performance
rendering engine for scalable graphics generation.
Advanced annotation, axis layout,
conditional trendlines, rule-based
transparencies, dynamic chart-inchart tooltips, internationalization
and icon-based legends are just a
few of the impossibilities with most
unsophisticated charting packages
that aren’t pure data visualization
systems.
The pipeline is an effective way to
capture a large query and/or build a
sizable array of disparate values
from any combination of static or
real-time inputs and frees an application from being dependent on
highly aggregated or pre-calculated
data strings that are the only connection between data and a visualization.
The OpenViz API was created specifically for use by ISV and OEM
teams committed to differentiating
their value proposition with highly
effective visualization features that
accent the underlying data and eclipse the generic look and feel of
commodity charts.
As data becomes larger and more
complex the need to embrace nontraditional methods of visualization
is essential for any long-term product strategy. Switching graphics
platforms or vendors every few release cycles is impractical and inefficient. OpenViz has a ten-year release history of providing distinctive
user experience to many types of
OEM clients. To understand how,
request an online demo.
A large selection of OpenViz components enable a variety of statistical,
computational and data management functions that radically innovate the range options available to a
product team seeking to synchronize a proprietary business process,
algorithm or workflow with interactive components of a user interface.
Each time that an end user interacts
with an application through a serverside AJAX (or Java or .NET clientside) element such as a slider, gesture, region selector or click-to-drill
action, the OpenViz data management pipeline responds with a dynamic generation of refreshed inmemory values that are pushed to
the OpenViz graphics renderer.
AVS has a two-decade reputation of creating innovative data visualization software
products that have been used by over 2,000 ISVs, enterprises and research organizations to accelerate and improve decisions for nearly 10 million end-users.
• API with 200+ highly-configurable components for charting, data import, analytics
• Generate HTML5 or PNG graphics with
AJAX interactivity (or JAVA or .NET applets) from any data on any platform
• One app travels from desktop to tablet to
touch surface with no code changes
• In-memory features allow for large queries, algorithms, advanced analytics, lowlatency real-time visualization
Use Cases
• Advanced/next-generation dashboards
• Analytic applications
• Live infographics
• Multi-platform mobile apps
• Real-time network visualization
• Demanding ISV solution strategies
• Internal enterprise analytics programs
Reference clients
• Leading business intelligence platform
• Cutting-edge social analytics startup
• Top financial services platform
• Pharma/life sciences innovator
• Fortune 500 energy company
• Preeminent engineering ISV
• Global advertising agency
Licensing
• Single annual fee, no user count
• Includes support and special services
• Designed for any sized ISV or OEM
More information
• www.openviz.com
• (781) 890-4300 Ext. 2192
• Offices in Boston and London