عضویت
عضویت  ورود اعضا
 راهنمای خرید

Exaplog0 pages
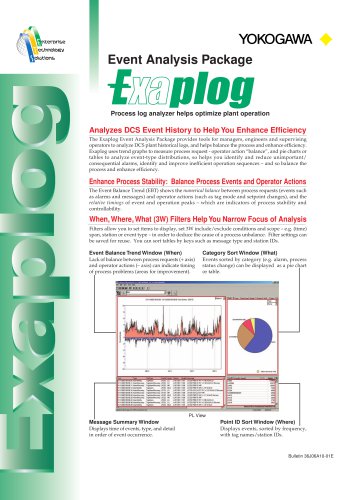
Event Analysis Package
Process log analyzer helps optimize plant operation
Analyzes DCS Event History to Help You Enhance Efficiency
The Exaplog Event Analysis Package provides tools for managers, engineers and supervising
operators to analyze DCS plant historical logs, and helps balance the process and enhance efficiency.
Exaplog uses trend graphs to measure process request - operator action “balance”, and pie charts or
tables to analyze event-type distributions, so helps you identify and reduce unimportant/
consequential alarms, identify and improve inefficient operation sequences – and so balance the
process and enhance efficiency.
Enhance Process Stability: Balance Process Events and Operator Actions
The Event Balance Trend (EBT) shows the numerical balance between process requests (events such
as alarms and messages) and operator actions (such as tag mode and setpoint changes), and the
relative timings of event and operation peaks – which are indicators of process stability and
controllability.
When, Where, What (3W) Filters Help You Narrow Focus of Analysis
Filters allow you to set items to display, set 3W include/exclude conditions and scope – e.g. (time)
span, station or event type – in order to deduce the cause of a process unbalance. Filter settings can
be saved for reuse. You can sort tables by keys such as message type and station IDs.
Event Balance Trend Window (When)
Category Sort Window (What)
Lack of balance between process requests (+ axis)
and operator actions (– axis) can indicate timing
of process problems (areas for improvement).
Events sorted by category (e.g. alarm, process
status change) can be displayed as a pie chart
or table.
PL View
Message Summary Window
Point ID Sort Window (Where)
Displays time of events, type, and detail
in order of event occurrence.
Displays events, sorted by frequency,
with tag names/station IDs.
Bulletin 36J06A10-01E
Page 1
13.12.18, 09:28
"